
Why architecture fails to impress executives, and how the FC method solves it
Most architecture diagrams fail because they show components, not meaning. The FC method fixes this by mapping use cases and shaping components by cost, revealing how value flows, where money goes and how intent becomes architecture, risk and spend.
A practical way to make complex systems understandable to executives, by mapping value, cost and intent through the FC method.
Most architecture diagrams are unreadable for anyone who is not an architect.
They look impressive. The colours are pretty. The boxes line up nicely.
But the moment you show one to an executive the conversation dies.
The meaning disappears in a single breath.
The problem is not the audience.
The problem is the diagram.
Architects think in systems.
Executives think in outcomes.
Finance thinks in money.
These three audiences do not share a visual language.
You can fix this with one simple approach:
explain the system through its use cases, not its components.
This is the FC method: FinOps Clarity, obviously, not Frank Contrepois.
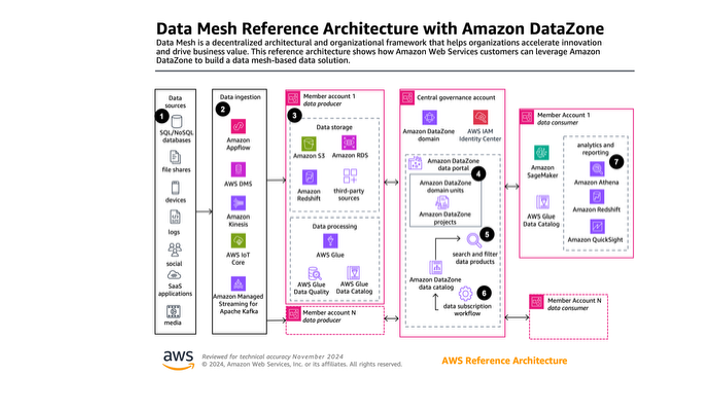
Why reference architectures fail outside architecture
Reference architectures try to show everything technical:
every service, every path, every integration point.
Useful for architects.
Not useful for anyone else.
A system becomes meaningful only when you understand why it exists and what flows through it.
Top-down FinOps needs this clarity because cloud spend only makes sense when you can see how intent becomes architecture and how architecture becomes cost.
The FC method restores that meaning.
Use cases: the anchor of the FC method
Most diagrams answer the wrong question: what does the system look like?
Non-architects need a different answer:
what does the system do, and why does it matter?
The FC method starts by selecting the three most important use cases and mapping the architecture only for these flows.
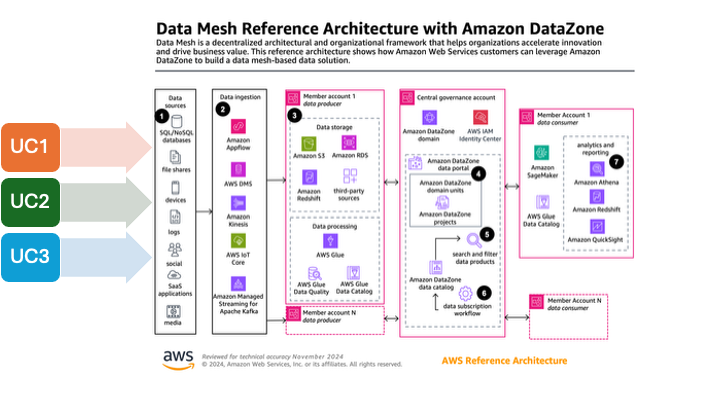
Three usually represent most of the value and most of the cost, which makes them a natural anchor.
Each use case becomes a value pathway: a clean, annotated story of how the organisation delivers something meaningful.
A use case is easy for an executive to follow.
A diagram is easy for a technologist to follow.
What has always been missing is the cost.
Shape as a signal for cost: the visual language of the FC method
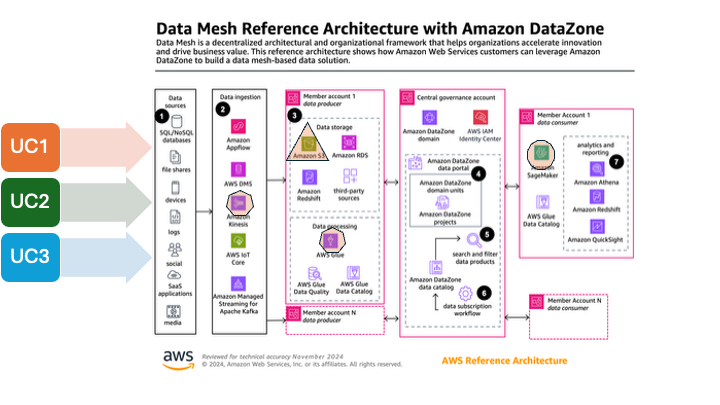
The FC method introduces a simple glyph language:
- Triangle → low-cost primitive
- Square or polygon → mid-cost component
- Circle → high-cost service
The fewer the angles, the lower the cost.
This allows a non-architect to see, at a glance:
- which components matter financially
- which components are incidental
- where cost hotspots lie
- where optimisation will actually change the numbers
No price lists, ratios or unit metrics.
A circle tells its own story.
The FC walkthrough: how the system actually behaves
A good FC walkthrough follows a simple structure.
- Start with the user goal.
A data producer publishes a dataset. - Trace the flow.
Highlight only the components that matter for this use case. - Show the cost shapes.
Triangles, squares, circles. - Explain the trade-offs.
Faster or cheaper.
More control or less.
Safer or riskier. - Tie it back to value.
This path enables X. Here is why it matters.
By the end an executive can see:
- the flow of value
- where the money goes
- where the risk sits
- how architecture enforces or breaks strategic intent
This is the clarity top-down FinOps requires.
How the FC method exposes architectural drift
Mapping three use cases often uncovers:
- components that cost money but add no value
- integrations no one uses
- duplicated logic
- boundaries that have quietly disappeared
- areas where optimisation cannot help because intent was unclear
This is the moment executives understand why bottom-up FinOps reaches its limits.
You cannot optimise your way out of architectural incoherence.
Only the Why–What–How cascade can fix that.
The FC method becomes the bridge between these layers.
Where boundaries must be added or removed
In some organisations AI has effectively removed all boundaries.
Use as much as you need. Experiment freely.
An FC diagram makes the consequences visible:
- which high-cost services sit in the use case path
- where spend accelerates
- how much variance the system introduces
- which flows require governance
If there is no boundary, FinOps must ask for one.
Not to restrict innovation but to prevent accidental financial drift.
Boundaries protect the organisation; they do not limit it.
The same principle exists in democratic governments: boundaries protect the system rather than constrain it. Cloud vendors should adapt to that reality.
Why Finance finally understands the architecture
Finance does not need to learn the architecture.
It needs to understand how architecture shapes money.
The FC method shows:
- what drives cost in human-understandable flows
- where spend is predictable
- where it is elastic
- where variance originates
- how optimisation fits into the bigger picture
- why some savings matter in reporting and others do not
FinOps earns trust by explaining systems in a way that reveals economic truth, not technical detail.
Why the FC method belongs in top-down FinOps
Week 1 established that cloud becomes strategic the moment it touches margin, runway and risk.
Week 2 is about understanding the system beneath those decisions.
The FC method does exactly that.
It connects:
- value
- architecture
- cost
- risk
- boundaries
- and intent
in one readable, repeatable visual language.
It gives executives clarity, architects purpose and FinOps influence.
It is a method you can use, teach and reference by name.
The FC method is how architecture finally speaks the language of value.
Comments ()